Division of Research, Kaiser Permanente Northern California, Oakland, California
Approximately 30%–40% of screening-eligible adults in the United States are not up to date with colorectal cancer (CRC) screening. We aimed to validate a predictive score, generated by a machine learning algorithm with common laboratory test data, to identify patients at high risk for CRC in a large, community-based, ethnically diverse cohort.
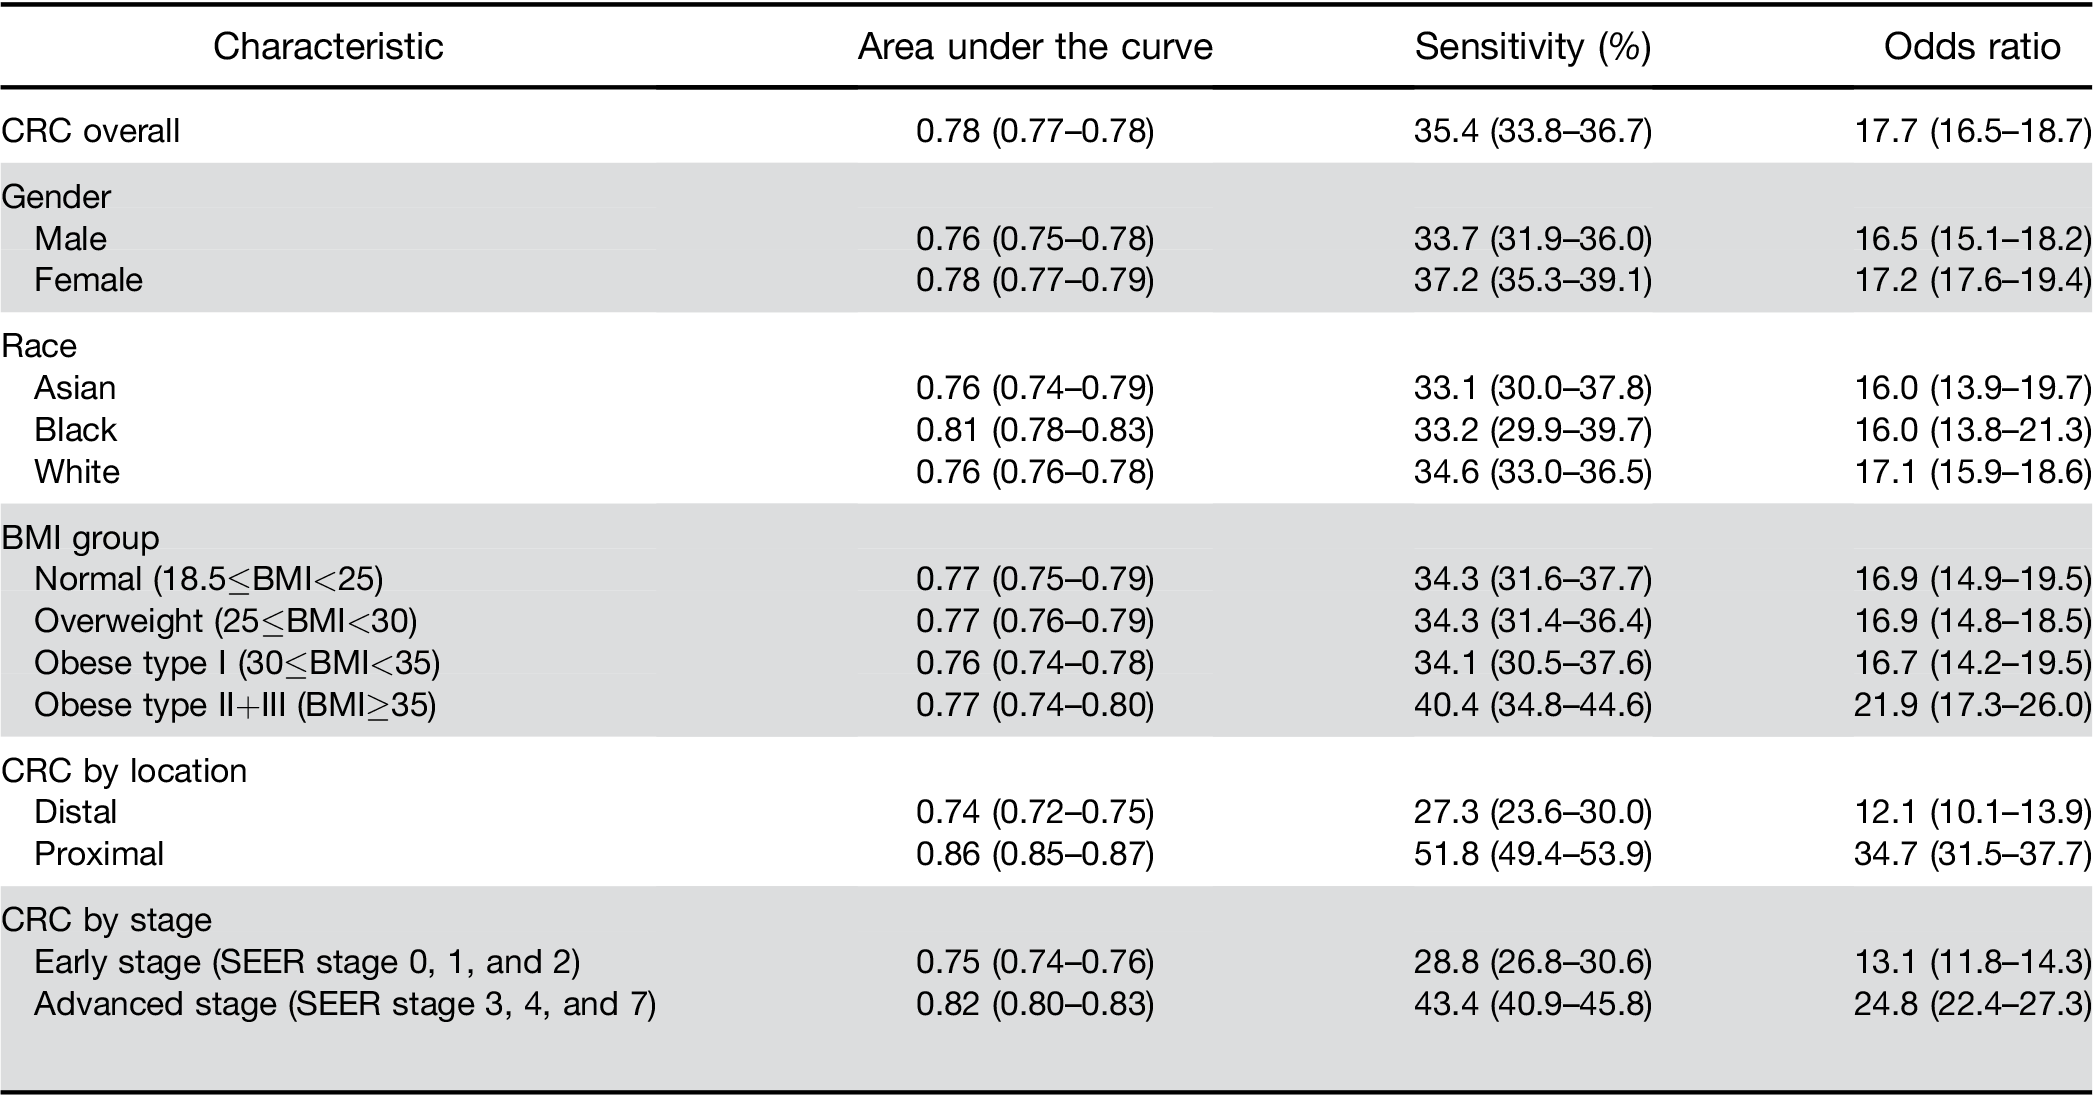
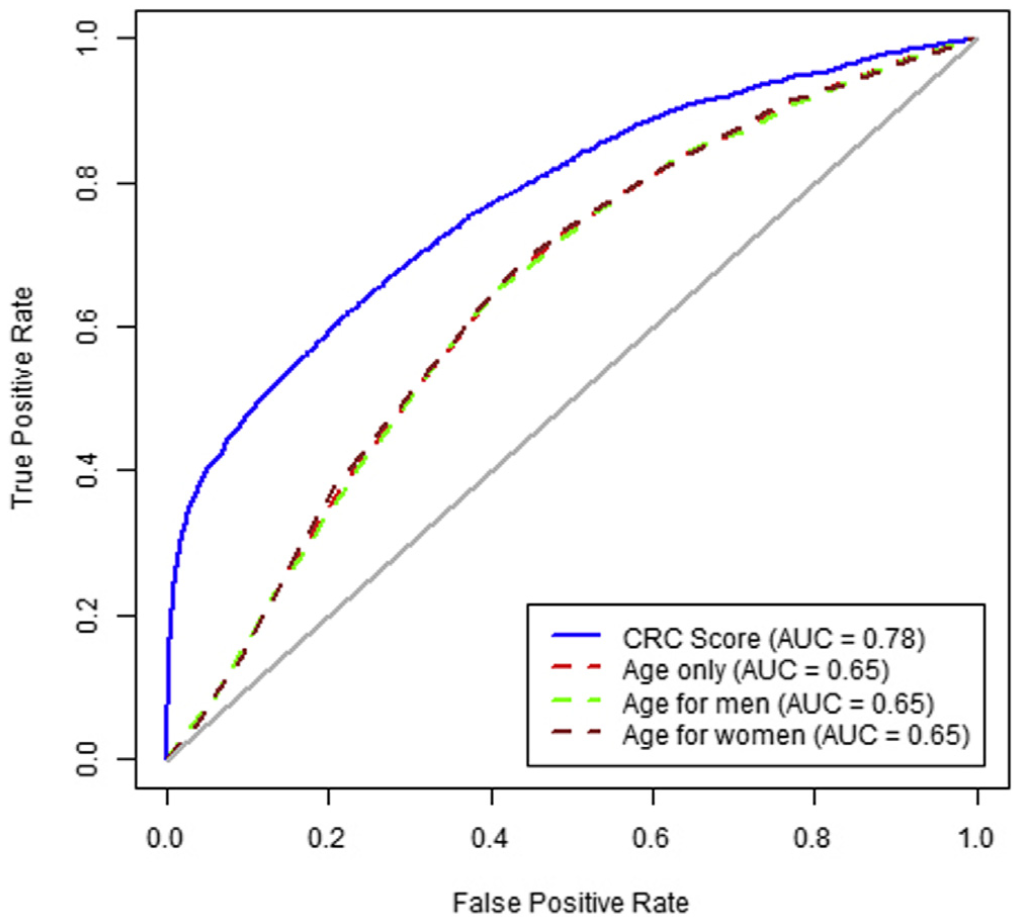
A high score from the algorithm identified patients with a CRC diagnosis within the next 6 months with 35.4% sensitivity (95% CI, 33.8–36.7) and an AUROC of 0.78 (95% CI, 0.77–0.78). Patients with a high score had an increased risk of diagnosis with early-stage CRC (OR, 13.1; 95% CI, 11.8–14.3) and advanced stage CRC (OR, 24.8; 95% CI, 22.4–27.3) within the next 6 months. In patients with high scores, the ORs for proximal and distal cancers were 34.7 (95% CI, 31.5–37.7) and 12.1 (95% CI, 10.1–13.9), respectively. The algorithm’s accuracy decreased with the time interval between blood test result and CRC diagnosis; performance did not differ by sex or race.
We validated a predictive model that uses complete blood cell count and demographic data to identify patients at high risk of CRC. The algorithm identified 3% of the population who require an investigation and identified 35% of patients who received a diagnosis of CRC within the next 6 months.
Keywords: Prognostic Factor; Early Detection; Stratification; Hematology.
Colorectal cancer (CRC) is the second leading cause of cancer death in United States.1 An estimated
1 in 22 men and 1 in 24 women will be diagnosed with CRC at some point in their lives, and 1.4 million Americans are currently living with a personal history of CRC.2,3 The American Cancer Society estimates that in 2017, there were 135,460 incident cases of CRC and 50,260 deaths in the US1 CRC-associated deaths accounted for approximately 8.3% of all cancer mortality.4
Decreasing mortality from CRC is largely dependent on the removal of precancerous polyps and the detection of early, treatable cancers, which are associated with more favorable health outcomes.5-9 The United States Preventative Services Task Force recommends screening for CRC using techniques such as fecal testing, sigmoid- oscopy, or colonoscopy, beginning when adults reach the
Abbreviations used in this paper: AUC, area under the curve; BMI, body mass index; CBC, complete blood cell count; CI, confidence interval; CRC, colorectal cancer; KPNC, Kaiser Permanente Northern California; OR, odds ratio; PPV, positive predictive value; ROC, receiver operating char- acteristic; SEER, Surveillance, Epidemiology, and End Results Program.
© 2020 by the AGA Institute 1542-3565/$36.00
https://doi.org/10.1016/j.cgh.2020.04.054
There is a need for simple tests that require minimal patient compliance to identify unscreened patients at high risk for CRC to target for additional outreach. The American Cancer Society estimates that only w60% of US adults older than the age of 50 are up to date with CRC screening by colonoscopy, sigmoidoscopy, or fecal testing.2 A simple test could also be used in settings with a limited colonoscopy capacity or to identify persons at high risk for postcolonoscopy cancers during the long durations between colonoscopy screening exams. Risk scoring systems using factors such as age, alcohol/ smoking status, and body mass index (BMI) have been developed, but these require active data acquisition and calculation by patients or providers.14 A potential inex- pensive and widely available strategy is through elec- tronically scanning commonly used laboratory tests for high-risk features, including tests obtained for other in- dications. A machine learning analysis in Israel evaluated multiple tests obtained during routine health checkups to identify those associated with future risk of CRC; the optimal combination used demographic and hematologic parameters from complete blood cell counts (CBCs), including red blood cell distribution width, hemoglobin, and mean corpuscular volume.15 The likely biologic mechanism is that even among those without overt anemia, low levels of blood loss from colorectal neo- plasms may cause subtle changes in such test profiles.16
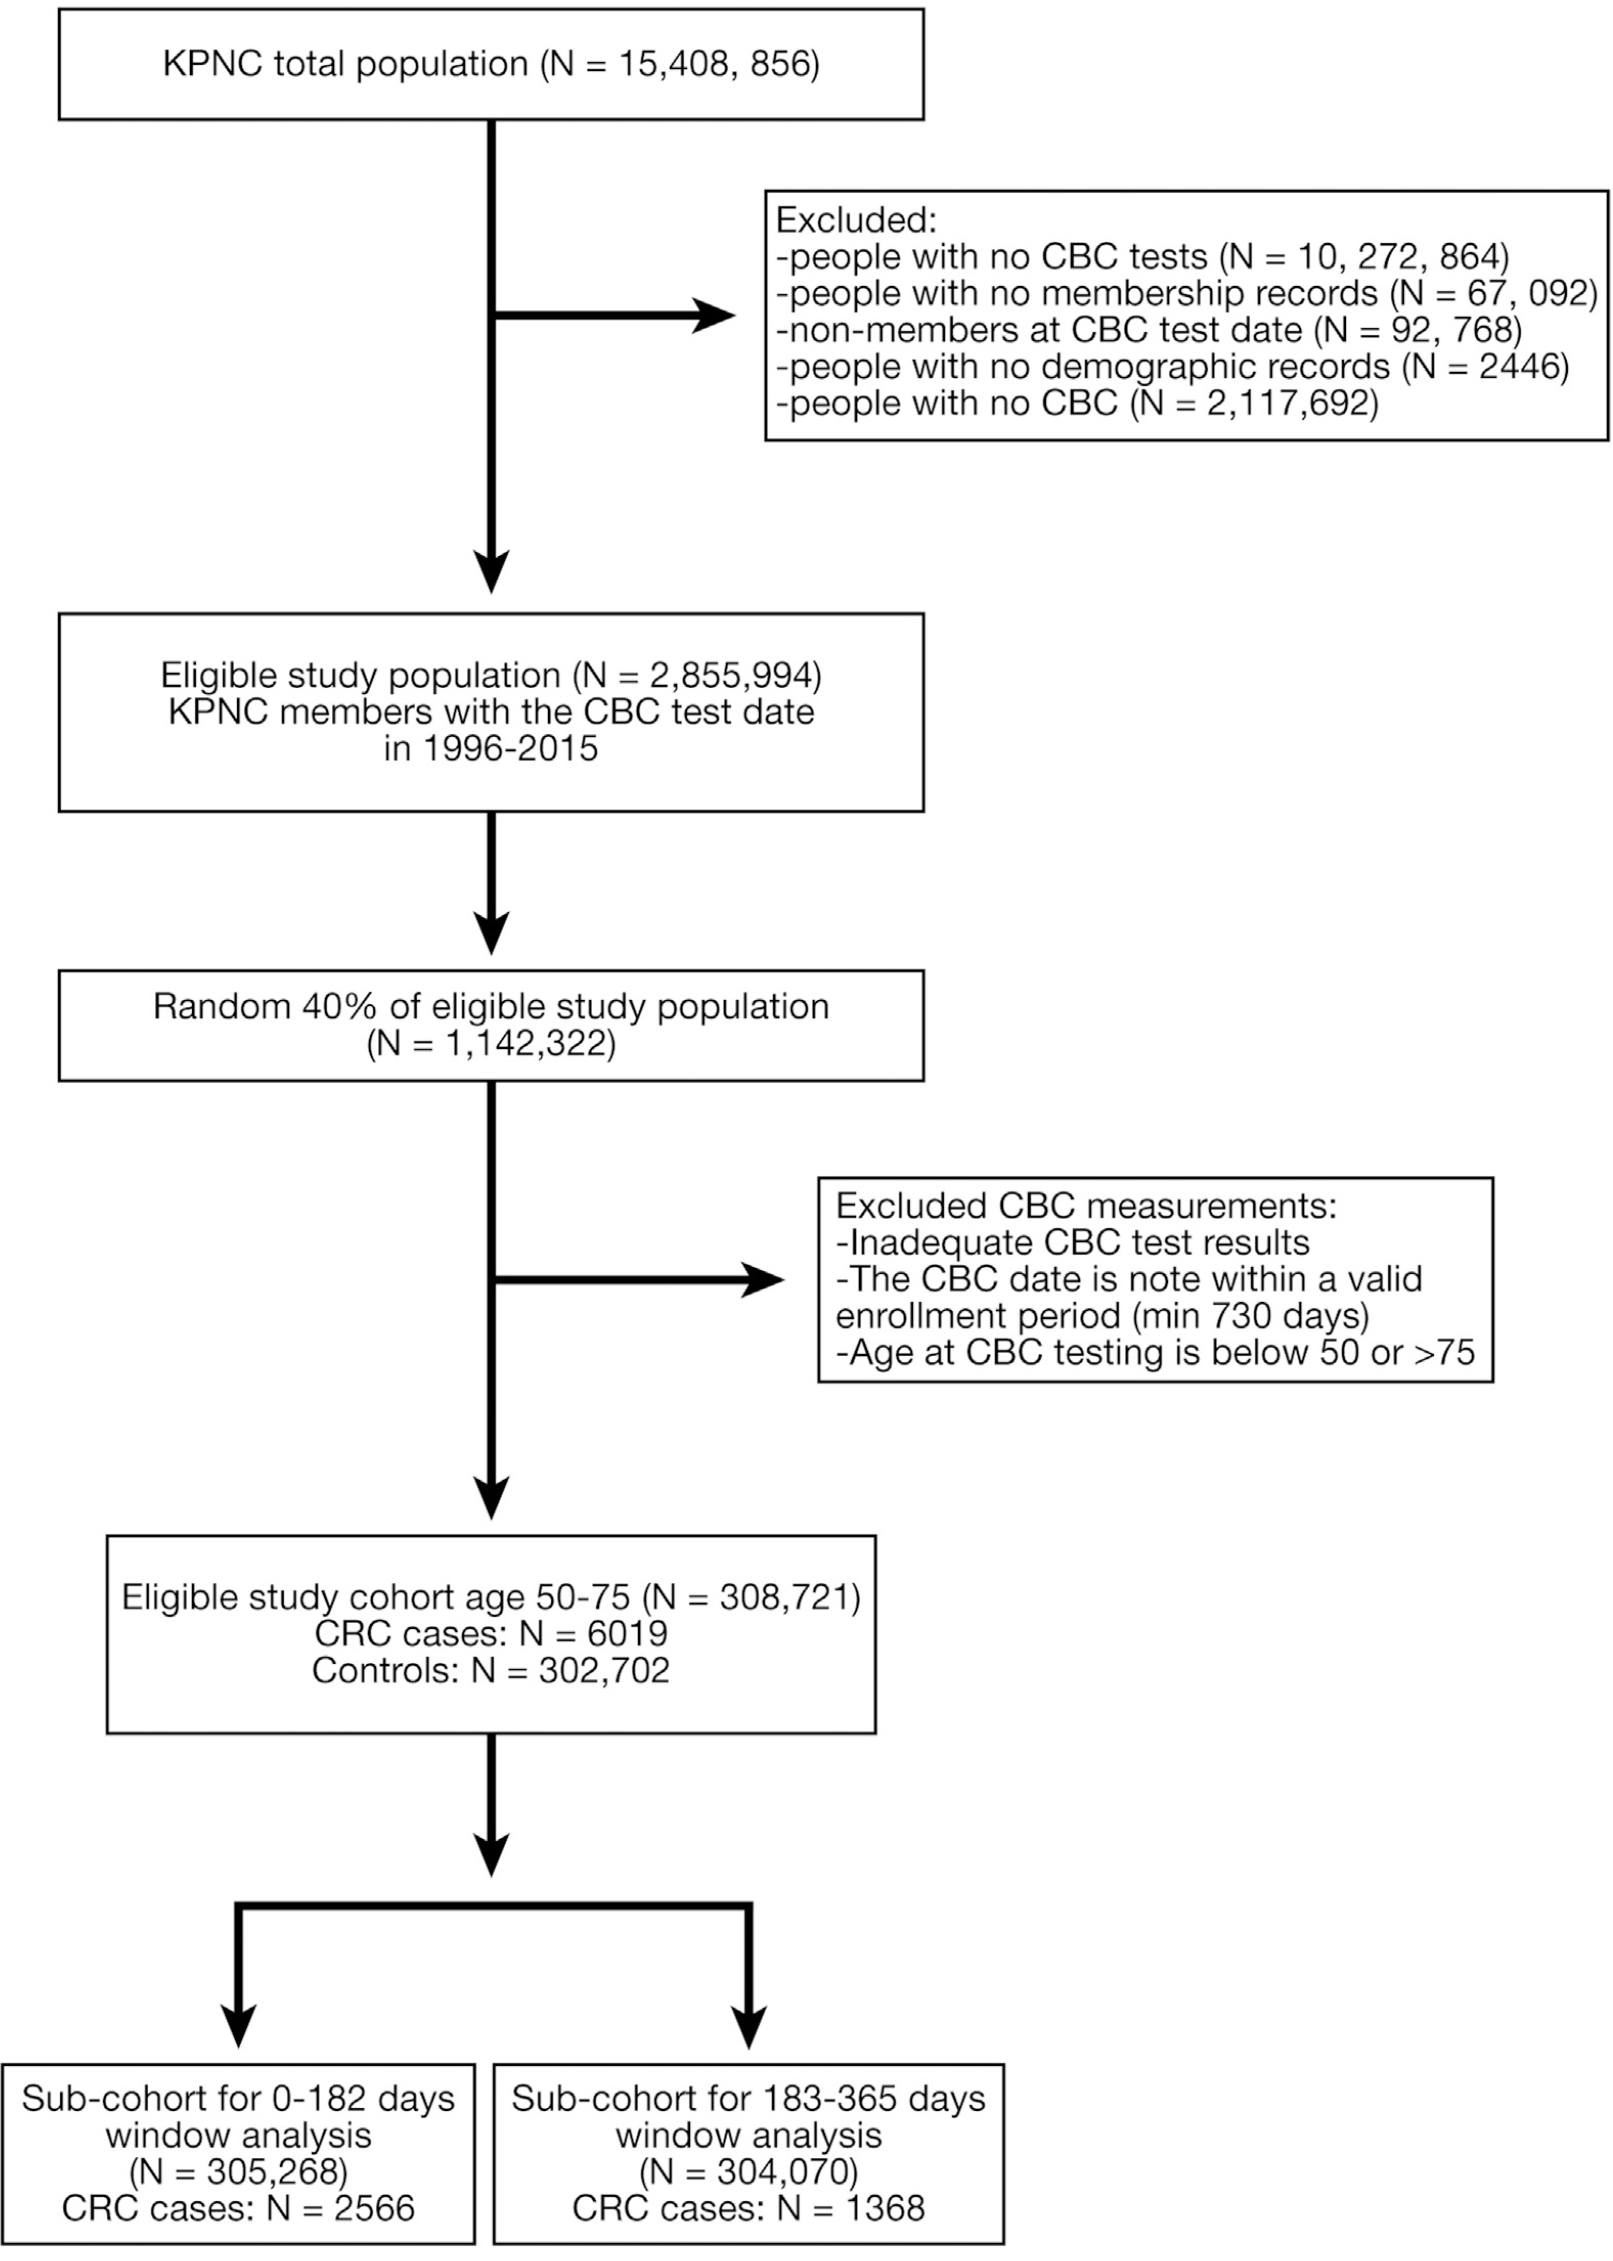
The current study evaluated the algorithm’s predictive score performance in an extremely large, community-based cohort with substantial diversity by race/ethnicity, comprehensive electronic health records, and long-term cancer follow-up.
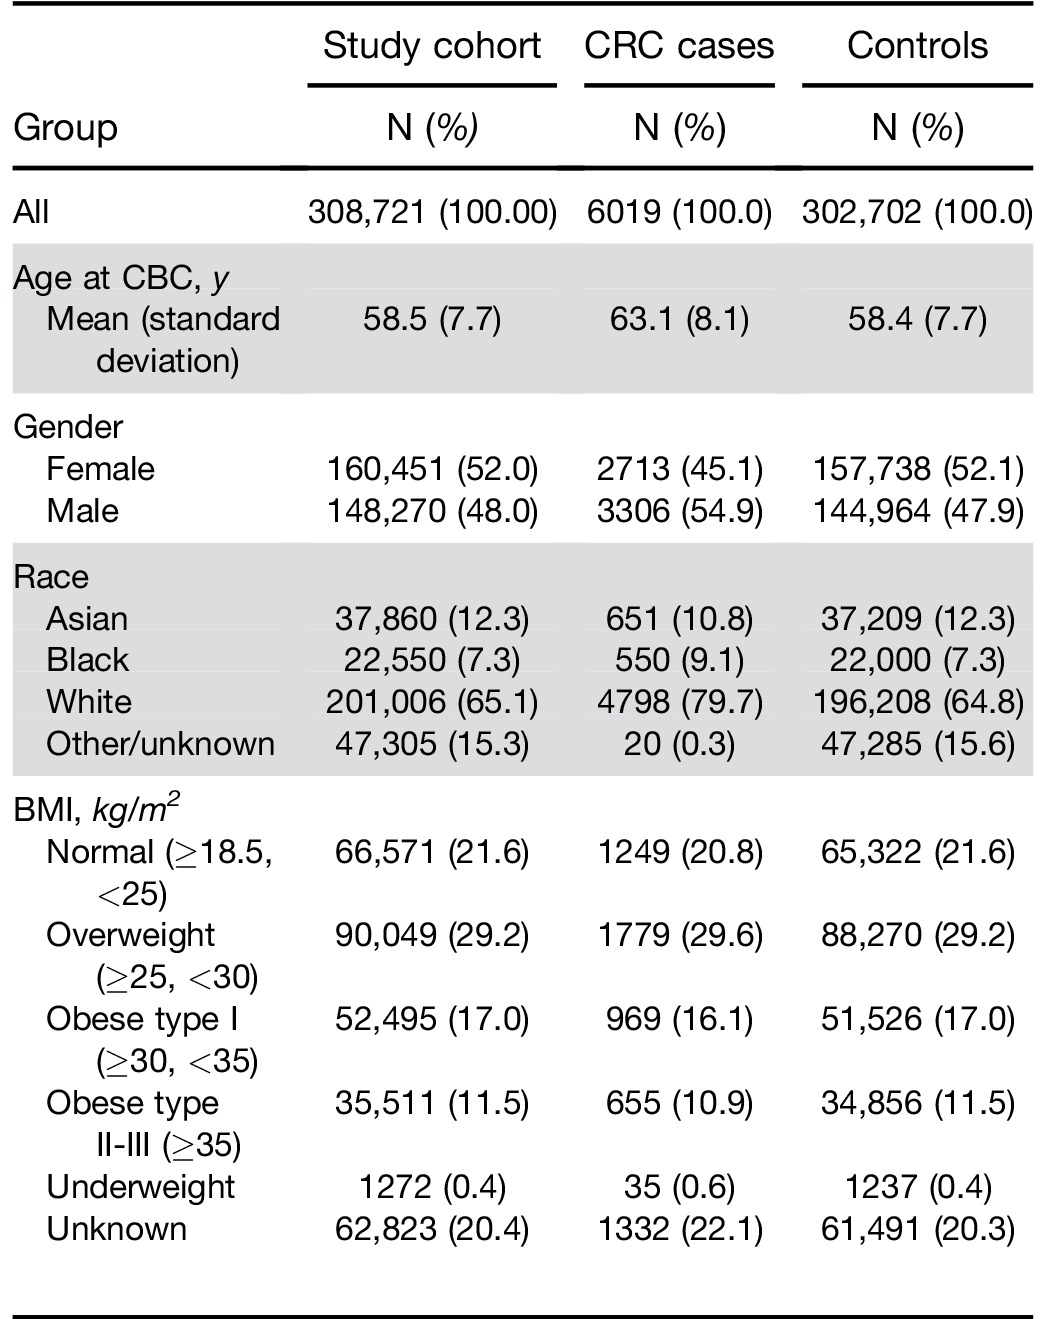
BMI, body mass index; CBC, complete blood cell count; CRC, colorectal cancer; KPNC, Kaiser Permanente Northern California.
Similarly, there was no significant difference in perfor- mance by race. When stratified by BMI, results were similar among individuals classified as normal, over- weight, or obese type I. However, the score had a higher OR and sensitivity for the group of obese type IIþIII (Table 2).
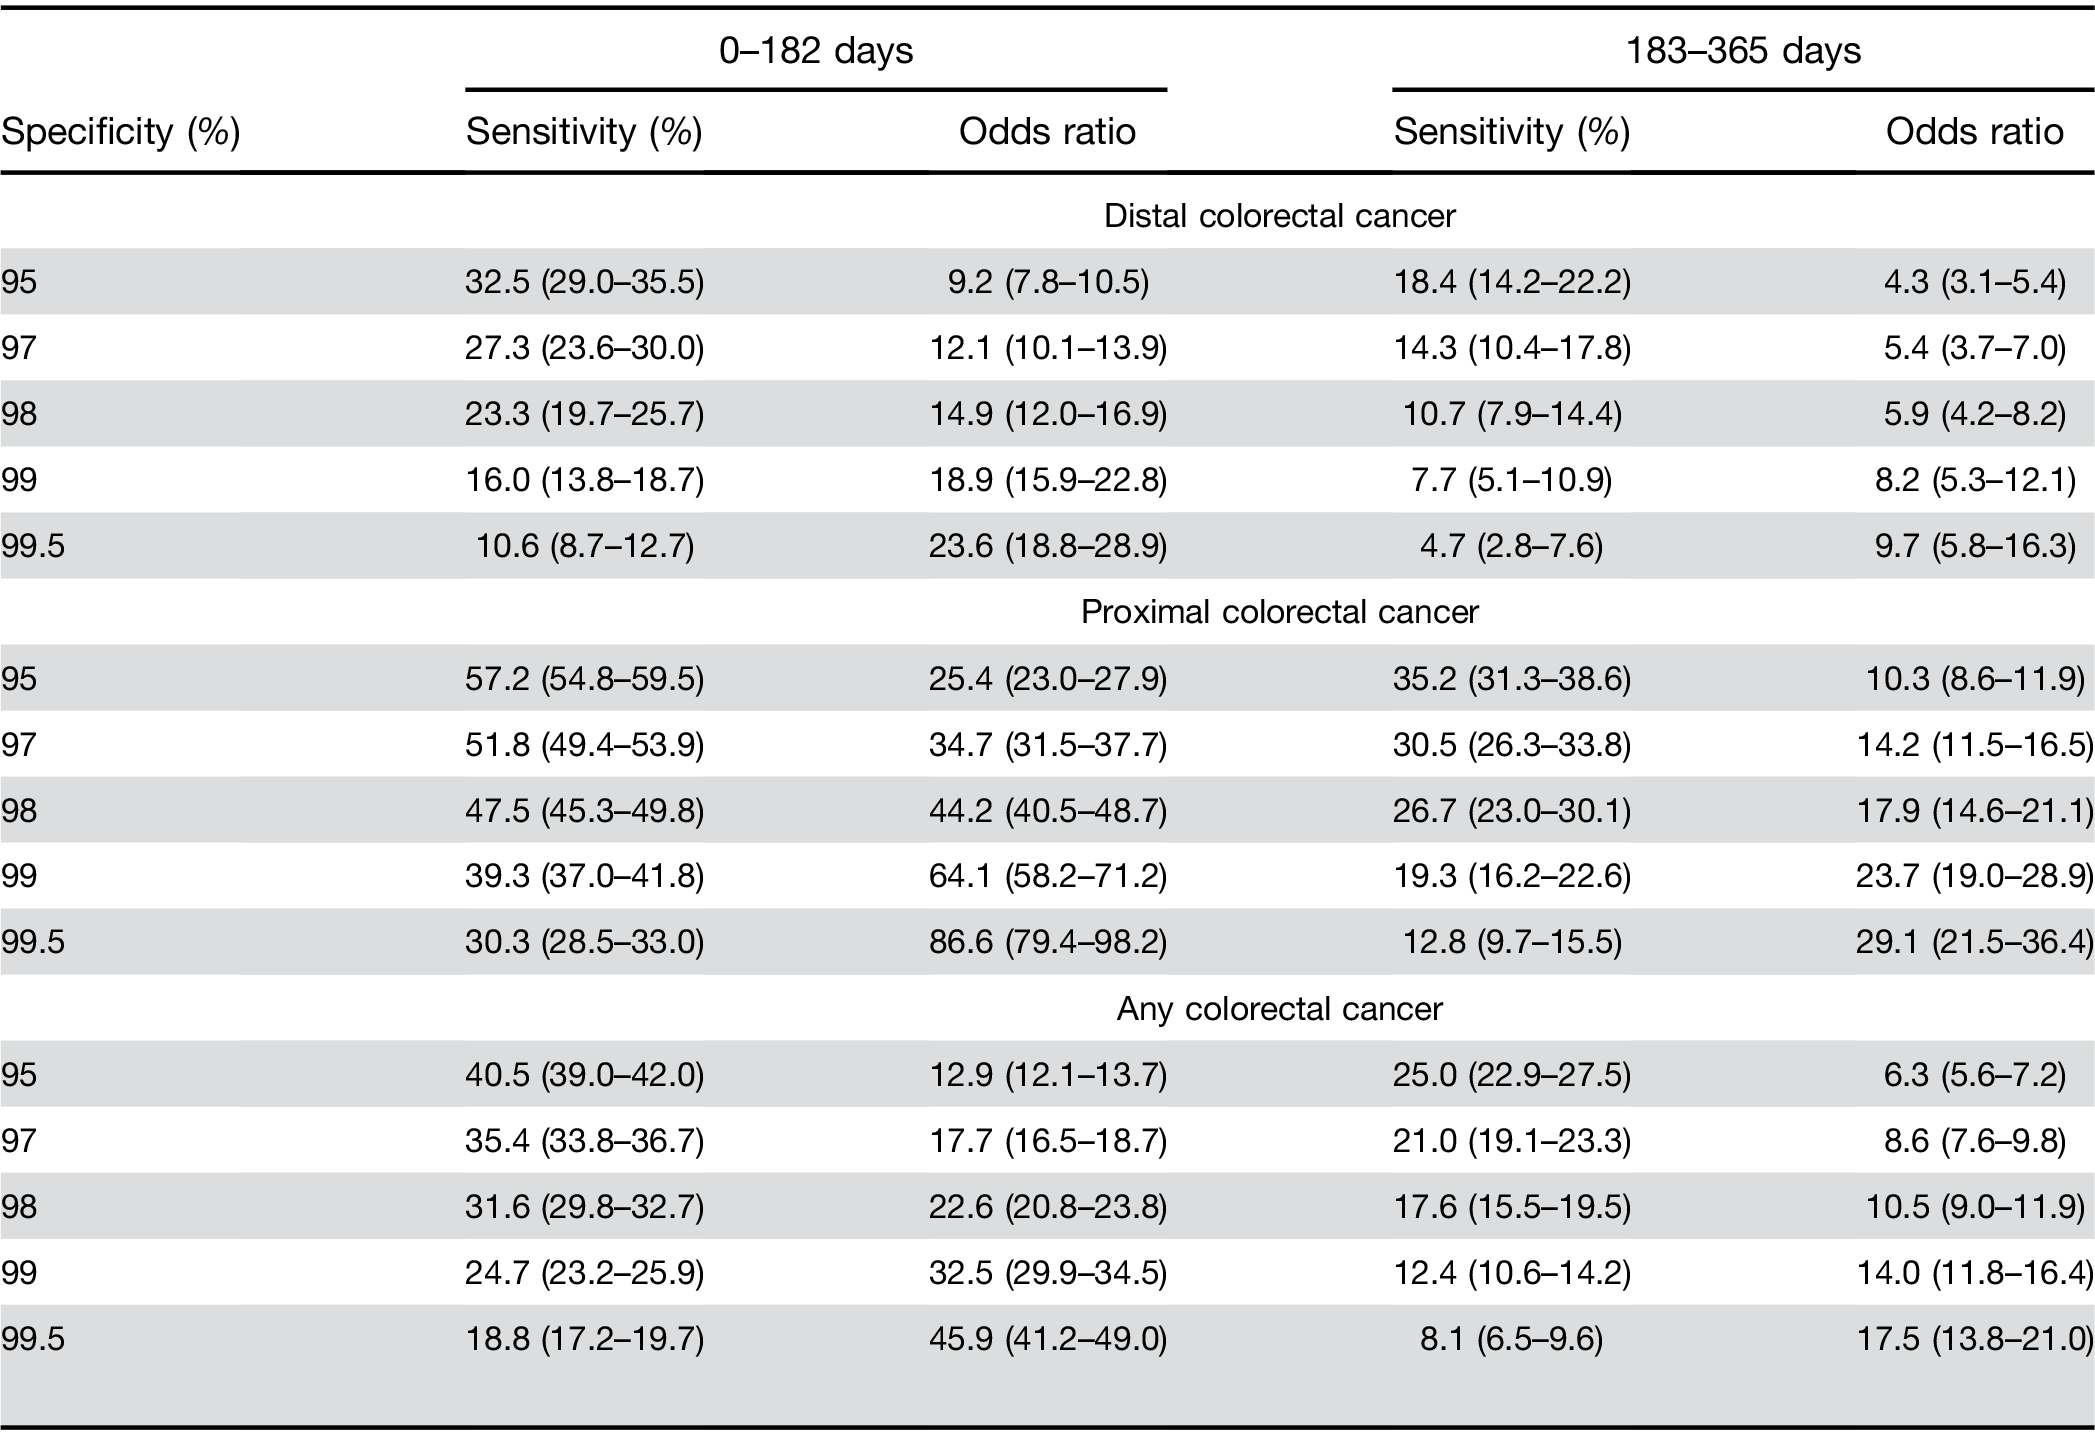
Colorectal cancer location. The model had a higher sensitivity for proximal cancer (51.8%; 95% CI, 49.4%– 53.9%) than for distal cancer (27.3%; 95% CI, 23.6%– 30.0%). The predictive model for above vs below the cutoff performed significantly better at identifying those at risk of proximal cancers (OR, 34.7; 95% CI, 31.5–37.7) than distal cancers (OR, 12.1; 95% CI, 10.1–13.9); P difference <.01; Table 2).
Colorectal cancer stage. The model had lower sensi- tivity for early stage CRC (Surveillance, Epidemiology, and End Results Program [SEER] stage 0, 1, and 2; sensitivity, 28.8%; OR, 13.1; 95% CI, 11.8–14.3) than for more advanced stages of CRC (SEER stage 3, 4, and 7; sensitivity, 43.4%; OR, 24.8; 95% sensitivity CI, 22.4–27.3), respectively; P difference <.01).
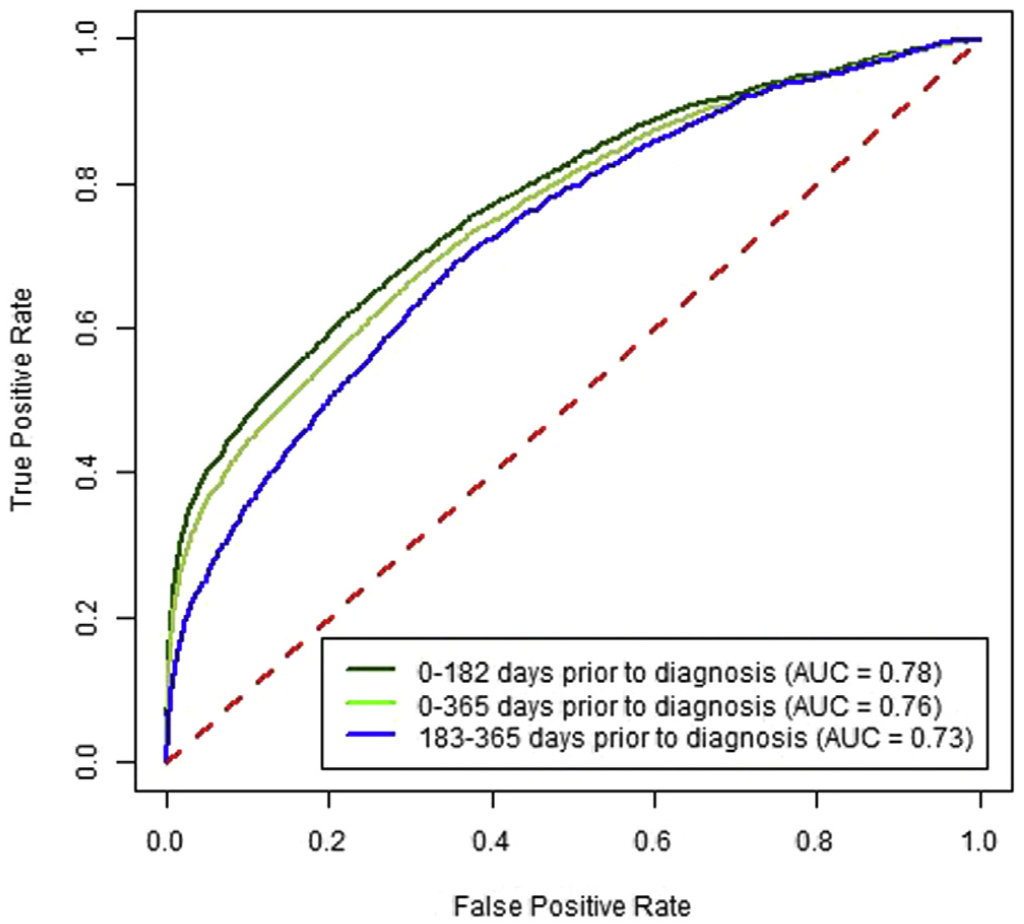
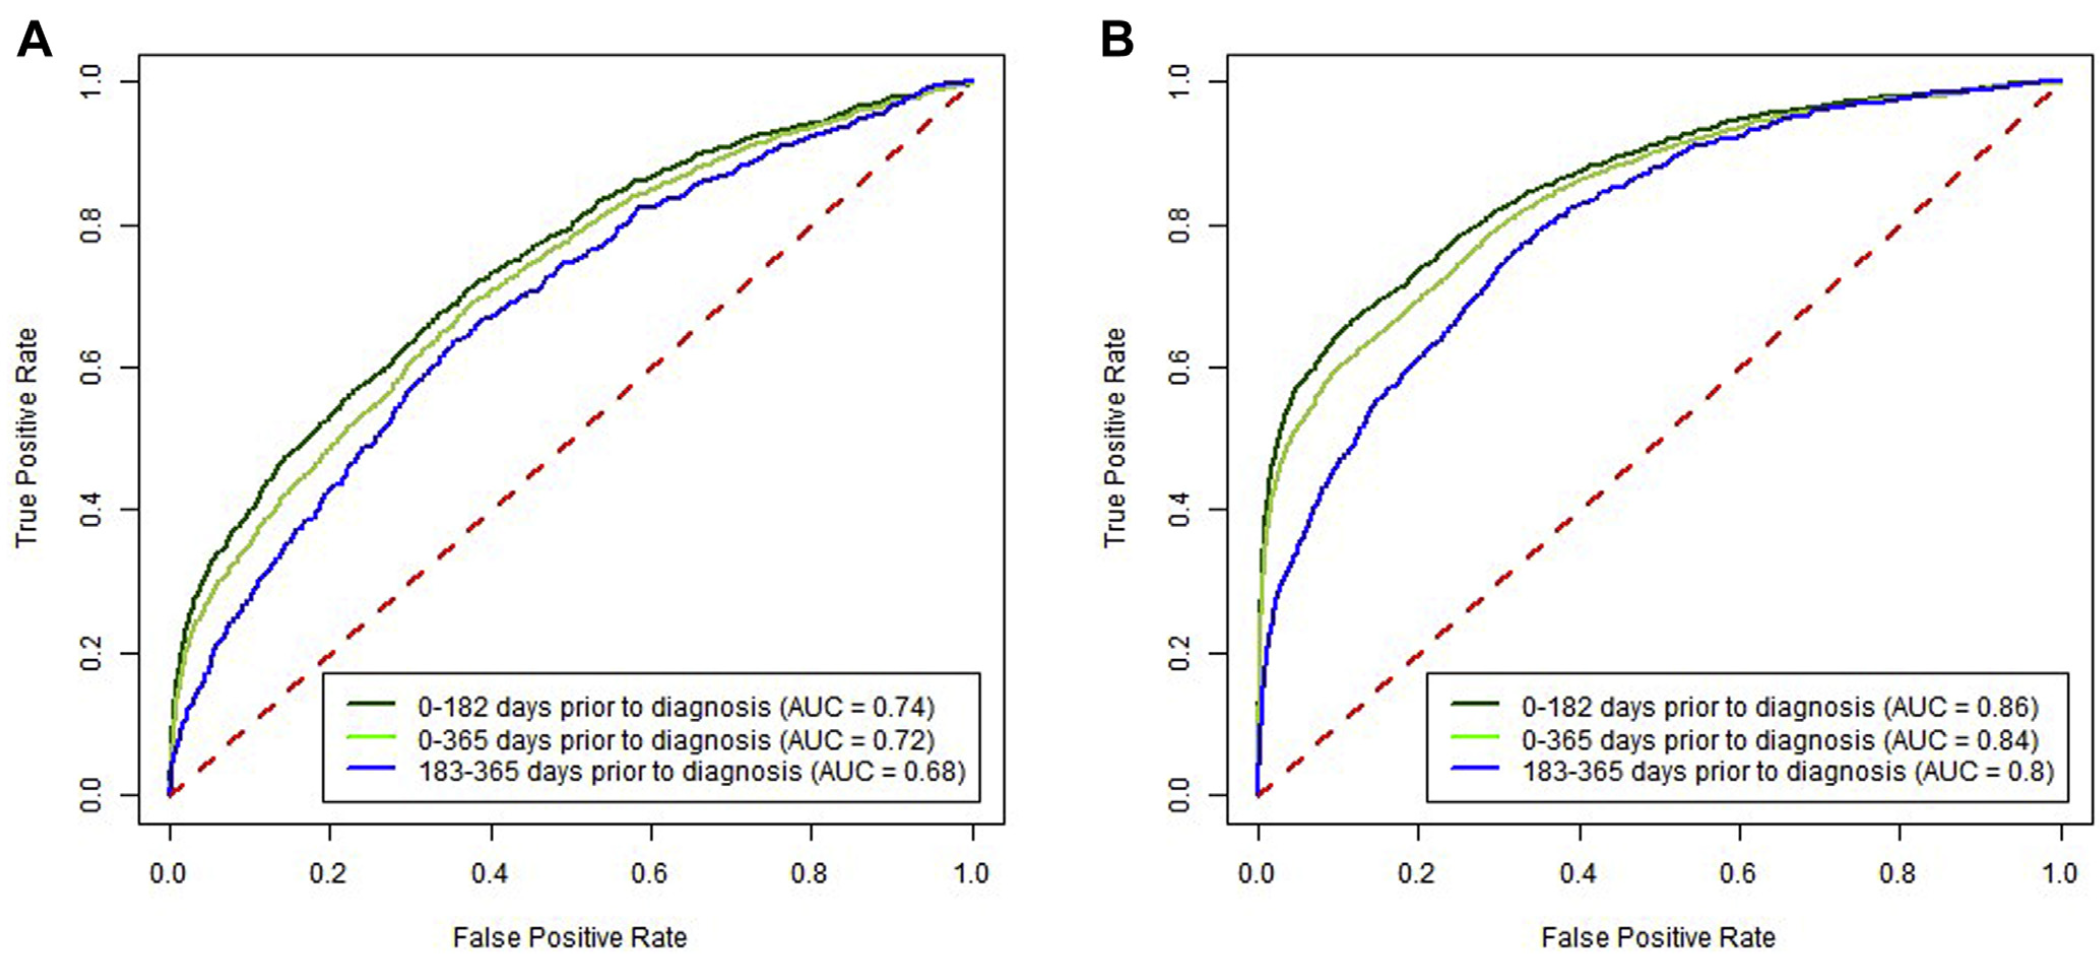
Predictive ability over time. Increasing time between CBC test and cancer diagnosis decreased sensitivity, whereas a significantly increased risk was maintained between high vs low results. The sensitivity for 0–182 days before CRC diagnosis was 35.4% (33.8%–36.7%), and for 183–365 days before CRC diagnosis it was 21.0% (19.1%–23.3%) at a specificity of 97% (Supplementary Figure 1). For high vs low scores, these corresponded to approximately 18-fold vs 9-fold increased risks, respec- tively (Table 3). For proximal CRC the OR was 34.7 (95% CI, 31.5–37.7) for CBC drawn 0–182 days before the CRC diagnosis compared with 14.2 (95% CI, 11.5–16.5) for 183–365 days (Table 3). For distal CRC, the OR was 12.1 (95% CI, 10.1–13.9) for CBC drawn 0–182 days before the CRC diagnosis compared with 5.4 (95% CI, 3.7–7.0) for 183–365 days (Supplementary Figure 2).
Predictive ability by score cutoff threshold. For prox- imal CRC at a (higher) 98% specificity level, the OR was 44.2 (95% CI, 40.5–48.7) for the time window of 0–182 days between CBC test and CRC diagnosis and 17.9 (95% CI, 14.6–21.1) for the time window of 183–365 days (Table 3). For proximal CRC at a 99% specificity level, an elevated score had an OR of 64.1 (95% CI, 58.1–71.2) for the time window of 0–182 days and 23.7 (95% CI, 19.0–28.9) for the time window of 183–365 days (Table 3). Similar trends for increasing sensitivity were seen for both distal and proximal CRC locations across the range of specificity levels presented (Table 3).
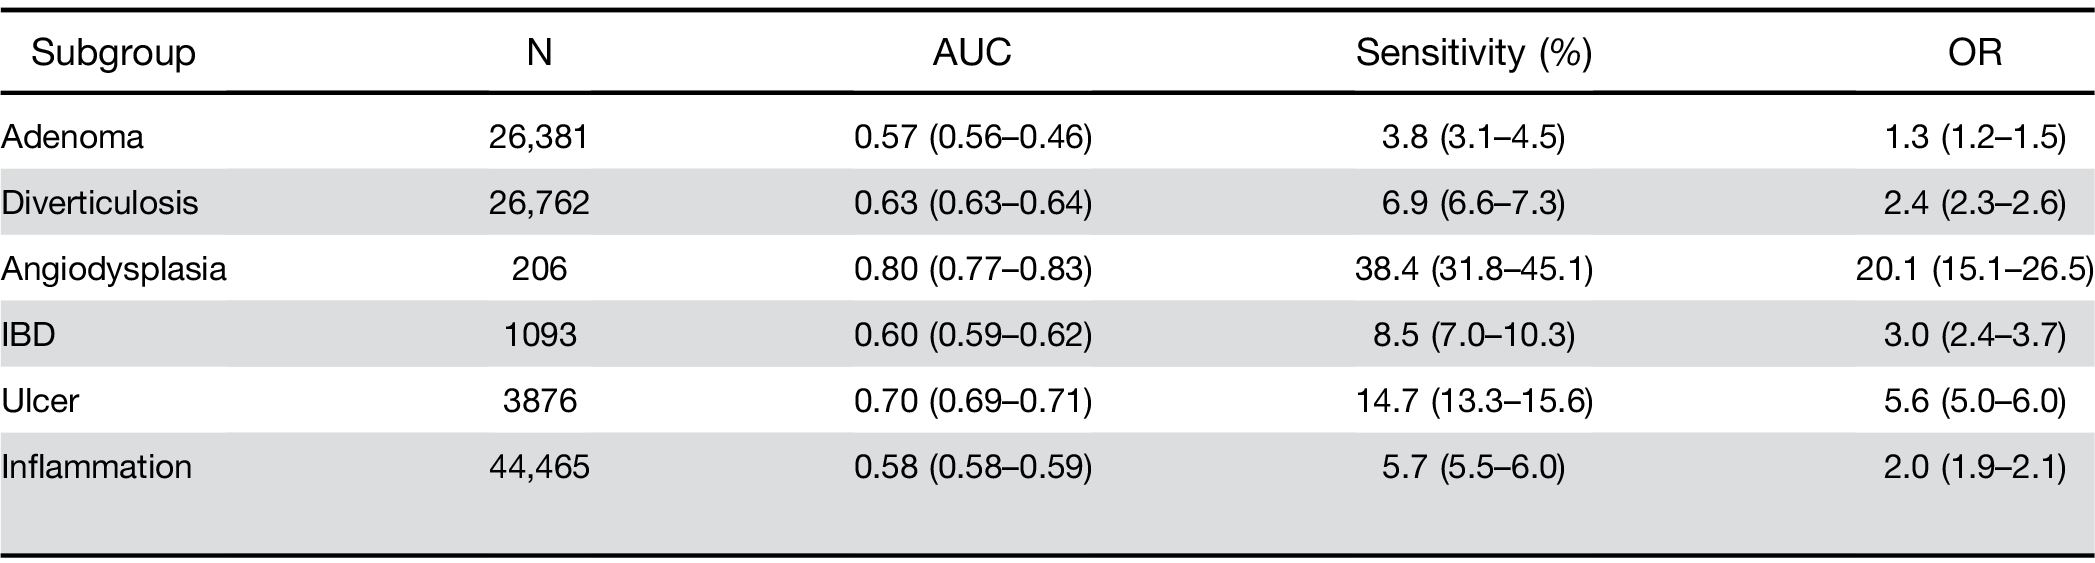
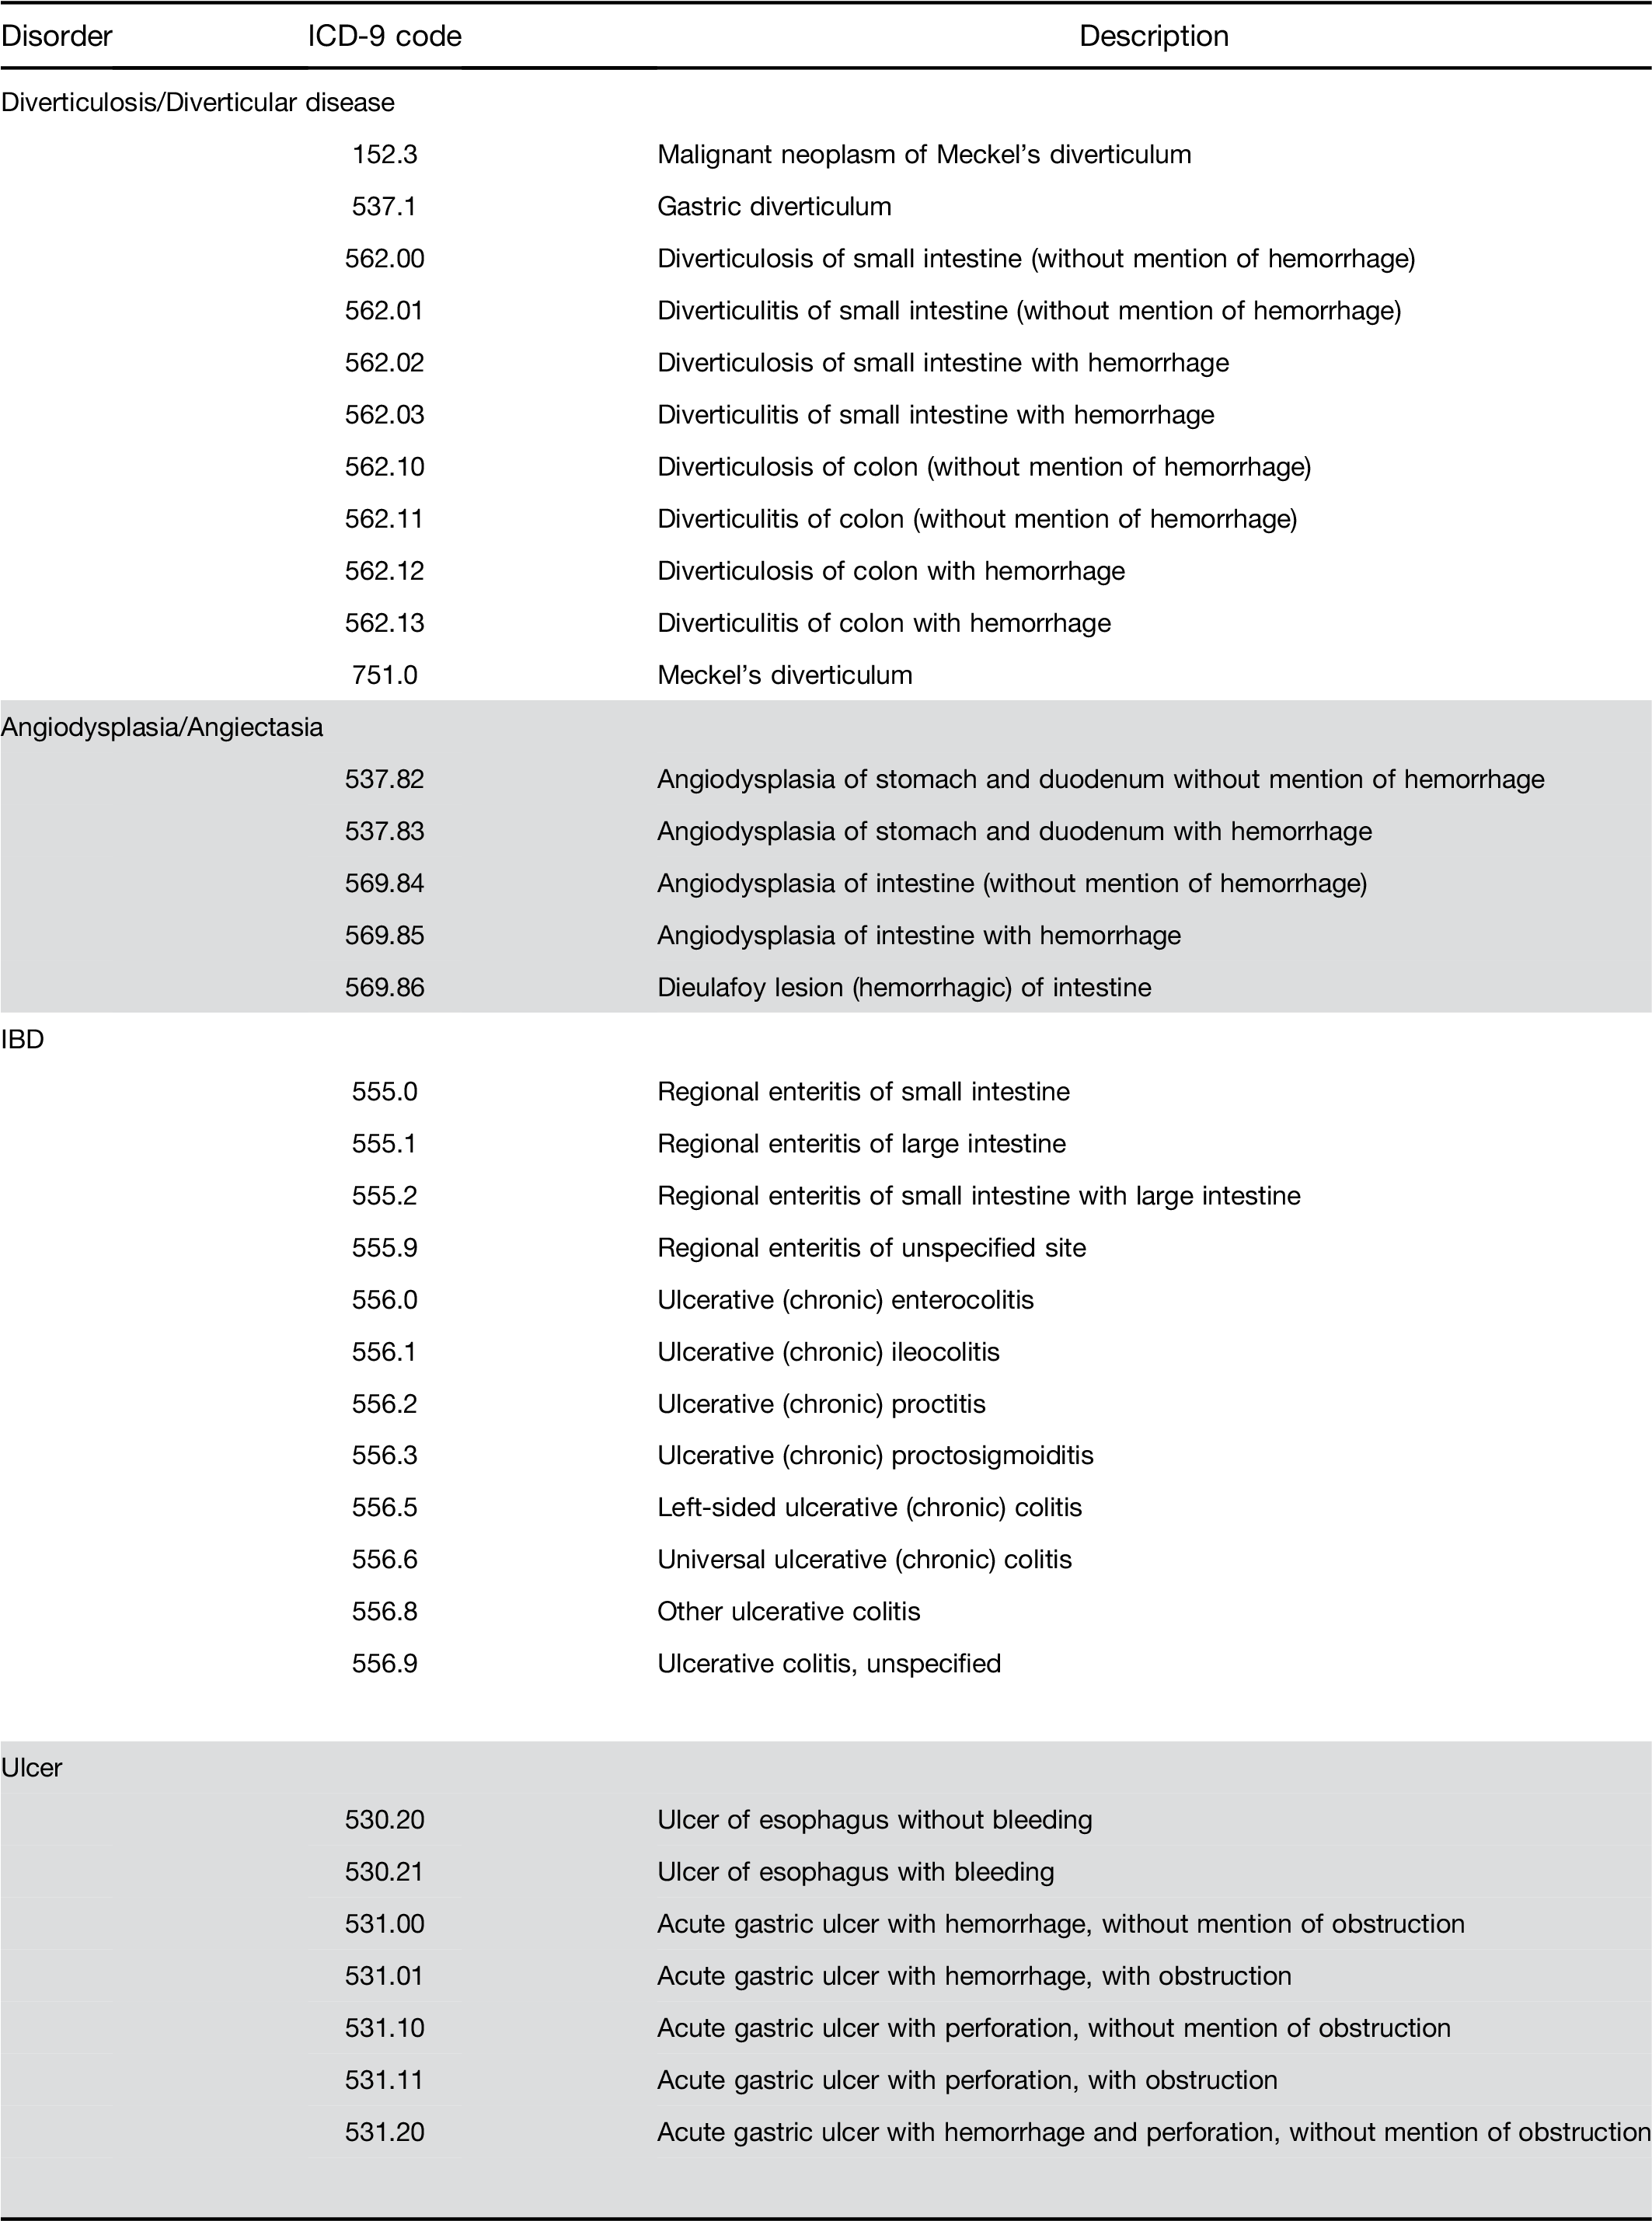
Adenomatous polyps and other outcomes. Among pa- tients receiving a screening colonoscopy, a CBC within 6 months predicted the presence of precancerous ade- nomas with AUC of 0.57 and sensitivity of 3.8% (Table 4). The model also identified persons with other lower gastrointestinal disorders, specifically those with bleeding tendencies such as ulcer and angiodysplasia (Table 4).
Services showed that individuals in the 99th percentile of scores were more than 20 times (OR, 21.8; 95% CI, 13.8–34.2) more likely to be diagnosed with CRC in the next 12–18 months.15 Within data from the Clinical Practice Data Link from the United Kingdom, scores associated with a specificity level of 99.5%, the OR for a CRC diagnosis was 26.5 (95% CI, 23.3–30.2) in a group of patients older than 40 years with 24 months of follow- up.20 In a US community-based population, the OR for detecting CRC was 7.1 at 97% specificity in patients aged 50–74 years, with CBC taken between 6 and 12 months before a CRC diagnosis,18 which was fairly similar to findings of the current study at the same specificity within the same time window and age group. Cumula- tively, these studies suggest that the predictive model can identify selected individuals at an increased risk of undetected CRC who can be targeted for more specific follow-up, such as colonoscopy. The replication across several populations, with slightly different follow-up intervals, including the current large, diverse community-based population, suggests the results should be generalizable to multiple settings.17
Over the past decade, CRC incidence and mortality in the US have declined for both men and women, at least in part associated with increased screening.21 A stronger emphasis has been placed on screening by national or- ganizations and initiatives and funding authorized by legislation such as the Affordable Care Act, which pro- vided tens of millions of uninsured Americans access to health care at low cost.10,22
These actions have reduced the burden of CRC in the US; however, disparities and inadequate screening rates are still common within many settings. It is estimated that differences in screening are responsible for 42% of the disparity between blacks and whites in CRC incidence and 19% of the difference in CRC mortality.23 Globally, the incidence of CRC is increasing; worldwide incidence and mortality are pro- jected to increase by approximately 60% by 2030.24,25 These increases in developing countries with inade- quate health care are likely due to limited access to early detection and substandard treatment when malignancy is identified.25 The use of inexpensive tests, which can be used on new or existing samples, may provide a low cost, readily available method to supplement existing screening efforts. The predictive model validated in this article is different from other screening modalities in that it requires no active participation from the patient. Instead, persons at higher risk of CRC can be identified by using existing CBC tests and basic patient data. The simplicity of the test may be acceptable to patients reluctant to undergo more intensive screening with co- lonoscopy; however, screening-eligible people should not routinely opt for this test in lieu of more proven tests with higher sensitivity, such as fecal immunochemical test and colonoscopy.26,27
Strengths of this study include the large study pop- ulation, which is representative of the demographics of Northern California, a diverse subsection of California.17 The population has high background rates of CRC screening (>80%) among screening-eligible persons. We used readily available electronic medical records to efficiently gather information for the cohort. In this setting, CBC data may be more readily available than in other community-based health care settings. Weaknesses of the study include the retrospective design, lack of comparable diagnostic data (eg, colonoscopy) on all the cancer controls, and inability to ascertain the specific reasons for blood testing.
Table 3. Model Performance at Various Specificity Levels for Distal and Proximal Colorectal Cancer at Different Time Windows For Persons Aged 50-75
In conclusion, this study validated the ability of a predictive model, derived from machine learning ap- proaches, to identify persons at increased risk of future CRC diagnoses in a large, diverse, community-based
population. This approach’s low sensitivity does not recommend it over effective primary screening methods such as fecal immunochemical test or colonoscopy; however, the model’s ability to detect CRCs before their clinical diagnosis suggests a potential for identifying more CRCs than would be recognized by regular screening alone. These results support further pro- spective evaluation to determine the method’s feasi- bility, efficiency, accuracy, and effectiveness in different clinical settings, as well as research to evaluate the influence of additional medical record data on test performance.
Table 4. Sensitivity Analysis for Adenomatous Polyp/s (Identified on Screening Colonoscopy) and Other Gastrointestinal Diagnoses for CBC Within 0–182 Days for Persons Aged 50–75 at Specificity Level of 97%
Note: To access the supplementary material accom- panying this article, visit the online version of Clinical Gastroenterology and Hepatology at www.cghjournal.org, and at https://doi.org/10.1016/j.cgh.2020.04.054.
Jennifer Schneider – Study Concept and Design, Drafting and Editing of the Manuscript
Evan Layefsky – Drafting of the Manuscript
Natalia Udaltsova – Analysis and Interpretation of Data
Theodore Levin – Study Concept and Design, Editing of the Manuscript Douglas Corley – Study Design and Concept, Editing of the Manuscript
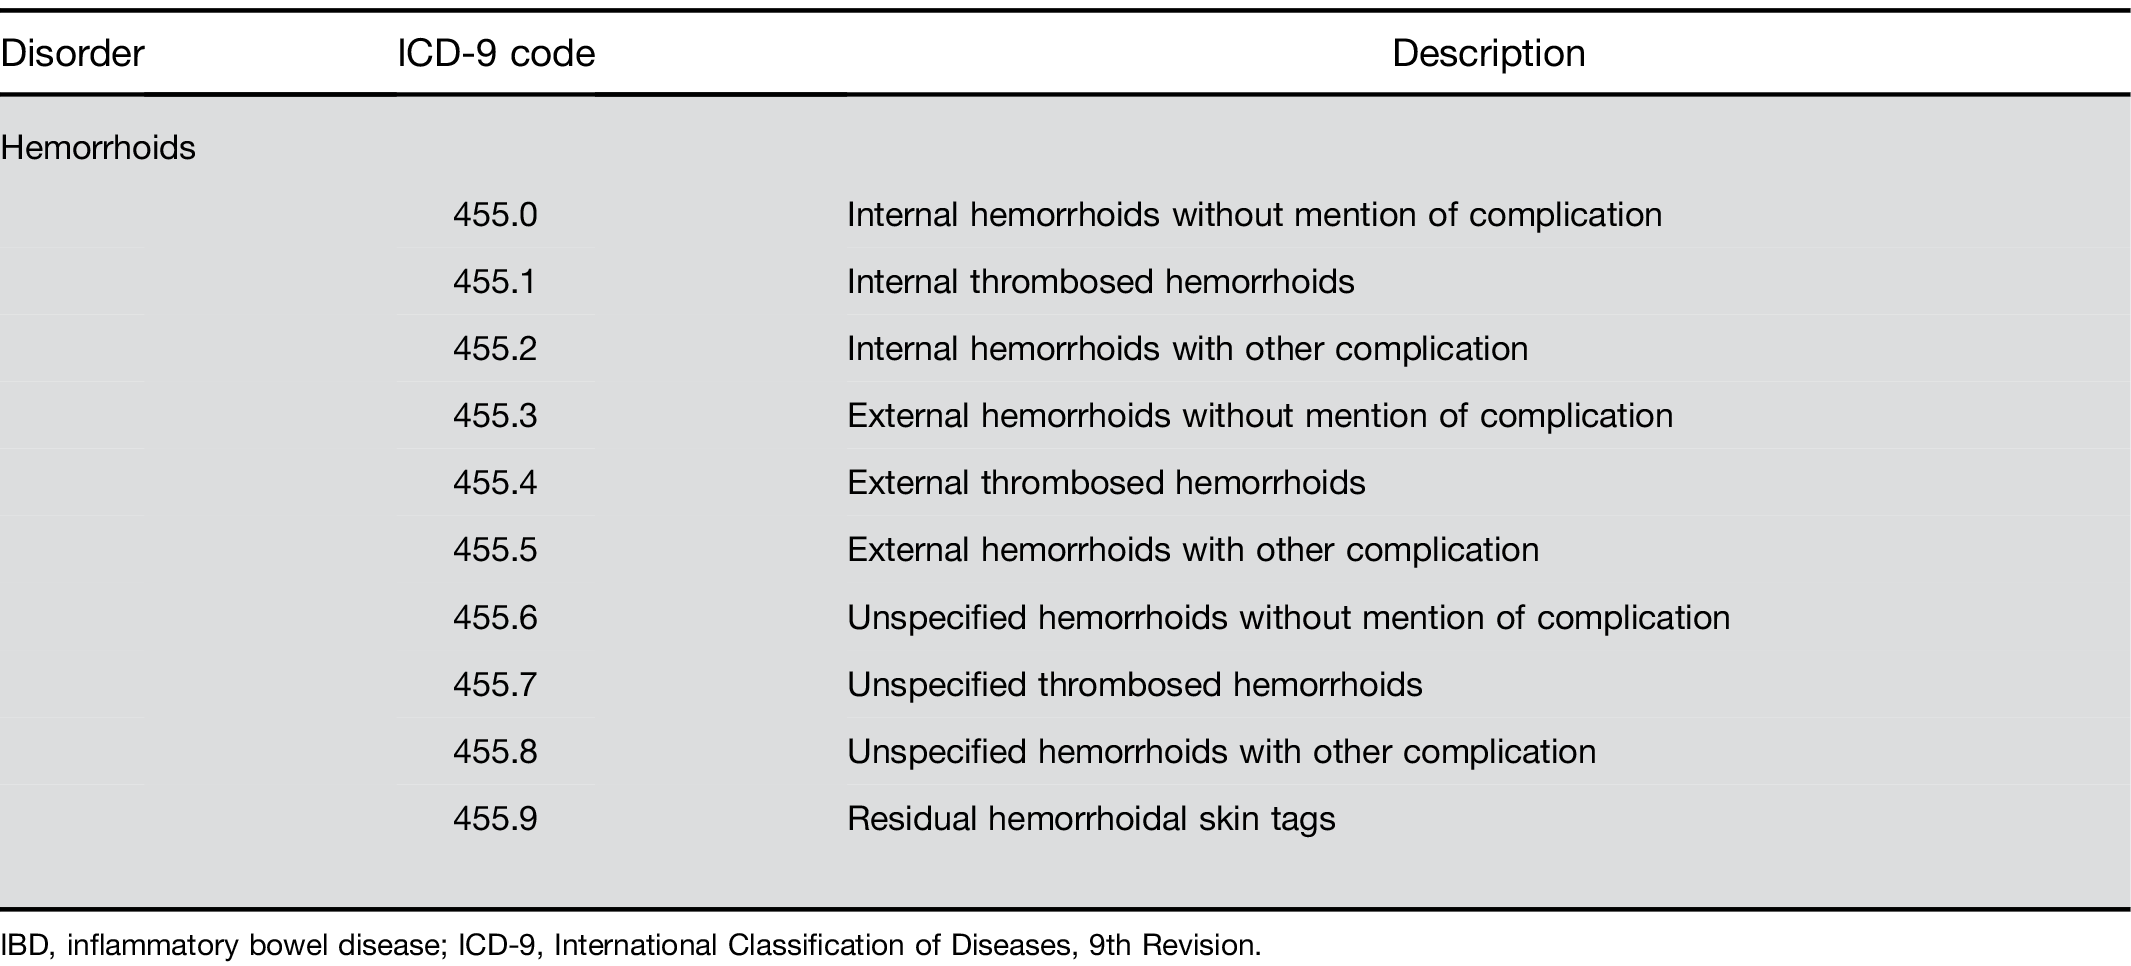
Supplementary Table 1. Continued
Supplementary Table 1. Continued
Supplementary Table 1. Continued
Supplementary Table 1. Continued